CCCM Somalia Data Hub
Using the Hub
a quick guide for donors, decision-makers and partner organisations
The Hub brings CCCM Cluster Somalia’s displacement-site information into one place — Service Mapping, Site Monitoring, Incidents and flood exposure, all anchored to the same master list of IDP sites. It is open without an account, and every figure is computed live from the database. Pick the lane below that matches your role. For what each number means, see How to read this data.
One source, several jobs
Donors, coordinators and field teams each start in a different place — but read the same live evidence.
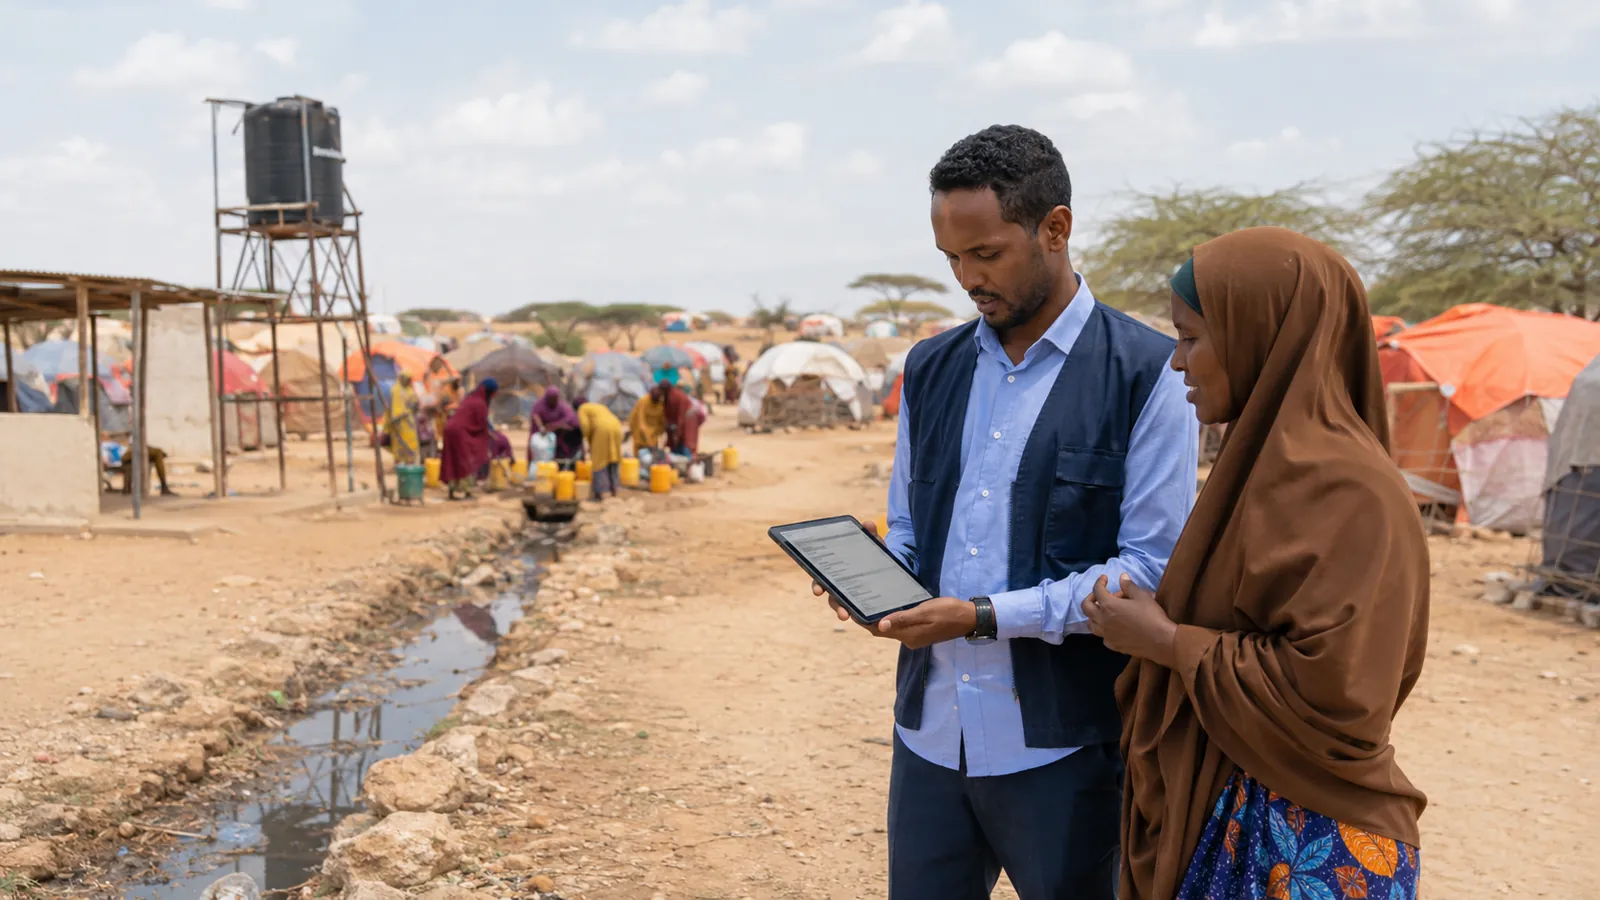
Illustrative context image. It does not represent the selected site or current field conditions.
Donors, partners & response planners
Deeq-bixiyeyaasha & qorsheeyayaasha jawaabta
Where is unmet need largest — and is the evidence current?
- 1
Start on Needs & Gaps — people at High/Extreme flood risk, sites not yet service-mapped, the most underserved districts and a shortlist of priority sites.
- 2
Click any site to open its full Site 360 evidence pack — services, conditions, incidents and flood risk merged into one profile.
- 3
Use the Download brief button on the board for a one-page summary, or take the raw tables from Reports → Data downloads.
Read the caveats. Flood-exposure and gap figures are a conservative floor — sites that aren’t yet assessed count as “need unknown”, never as “no need”. The Hub holds no cost data; it prioritises need and gap, not price.
Decision-makers & cluster coordination
Go'aan-qaadayaasha & isku-duwidda
What is the overall picture, and how far can I trust it?
- 1
Start on the Executive Summary — caseload, service coverage, site severity, partner presence, incidents and a data-confidence panel on one screen.
- 2
Focus the analytical views with the Region / District scope bar at the top of the page; it applies to Home, Executive, Needs & Gaps and Geography.
- 3
Download the executive brief for meetings, and check Reports → Data quality for record counts and last sync time.
Cite the report views. For official availability and severity percentages use Service Mapping → Availability report and Site Monitoring → Severity report — they reproduce the published national analyses.
NGOs, local partners & field teams
Hay'adaha & kooxaha goobaha jooga
What is happening at the sites we work in?
- 1
Go to Find an IDP Site and search your site to see its Service Mapping, Site Monitoring, incidents and flood risk in a single profile.
- 2
Explore by area on Geographic analysis (region, district or catchment) and track floods, evictions and fires on Incidents.
- 3
Pull the raw data from Reports — master list, incidents and monitoring exports, with enumerator names, phone numbers and GPS metadata already removed.
Switch language any time. Use the English / Soomaali toggle in the top bar. Public views need no account; upload, verification and admin screens stay restricted to CCCM staff.
Can’t find what you need? The methodology page explains the data sources, colours and scores, or contact the CCCM Cluster Coordination team at info@cccmclustersomalia.org.